The included help files contain a wealth of information on using MakerPlot-J (MPJ), including Quick Start information. This page will cover a few features of common interest.
Example Code:
The software installed with several sketches for testing MPJ with the Arduino and the Parallax Propeller. These can be opened from the Folder Menu–>Micro Code Folder. Simply download the code to your microcontroller and test with an appropriate installed interface.
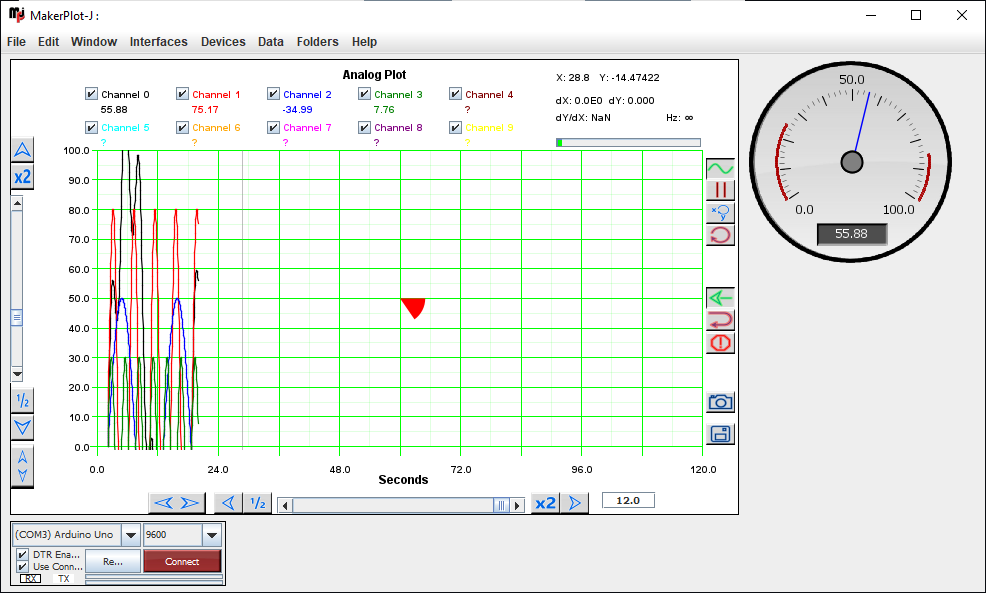
Analog Plotting
Send Analog data for plotting as CSV values, such as: 10,30,50.5 and MPJ will plot the data once connected. For the Arduino:
  // send analog data as num,num CR or LF
  Serial.print(temperature);
  Serial.print(",");
  Serial.print(pressure);
  Serial.println(",");   // end of line with LF
Digital Plotting
Send digital plotting on a digital plot or the analog plot (see analog plot’s pop-up menu) as %1010
  // Send digital values starting with %, ending with LF or CR
  Serial.print("%");
  Serial.print(heater);
  Serial.print(fan);
  Serial.println(stir);  // End line with LF
Create a GUI Interface
Construct an Interface for monitoring and logging. F9 to enter Edit mode, F2 to open Control’s Palette. Choose Controls and place.

The meter, named ‘met’, may be updated through code:
  Serial.print("!met=");
  Serial.println(temperature);
Or, the meter may have its automatic update value set to an incoming analog value though it’s pop-up menu (Data Source) or through its properties window (F3) in the Update Value.
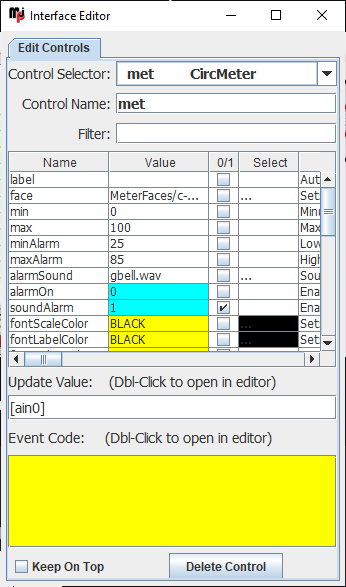
Event Code for controls use MPJ’s scripting instructions to perform some action when a control is triggered, such as a high alarm.

Drawing operations
MPJ Supports a wide range of drawing instructions to draw on plots, interface back grounds or Canvas Controls.

High-Level Math Operations
Perform math on values directly or using the Data Modifier. Math operations are defined enclosing in { }.
!plot.drawFilledArc 50a,50a,10,0,{[ain0] * 2 + 10},RED
Highly Versatile in Use!
+ Script Instructions from your serial data or MPJ Events.
+ Use your own images for backgrounds and images.
+ Quickly plot and construct interfaces for your data.
+ Have an idea but need some help getting started? Contact us.