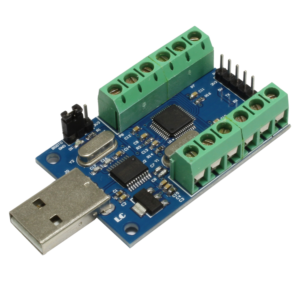
This code can be used with a variety of ADC modules, from suppliers such as these from Amazon.com: Link
Information for the ADC-10-F103C boards can be found on GitHub
An update to the help files (January 19, 2024) includes a code example for plotting different channels on different plot controls for an interface. Please see the help files (online or distributed), search for ADC to find it quickly.
These output in an ASCII format, such as:
CH0:2017 1.623V
CH1:2186 1.760V
CH2:0581 0.466V
CH3:1508 1.214V
CH4:1952 1.573V
CH5:2162 1.741V
CH6:2013 1.622V
CH7:2194 1.768V
CH8:2027 1.632V
CH9:2195 1.766V
MakerPlot-J can parse this string by pulling out the channel and voltage and plotting.
Simply select the Devices menu and select the ADC-10-F103C after opening an Interface and it will add compatible code for you. You may save the interface and it will work the next time opened.
OR use the following code and instructions below:
<message>!makeVar ch
<message>!makeVar value
<message>!ch={:: [messageString] ::2::1::subString }
<message>!value={:: [messageString] ::9::5::subString }
<message>!plot.plotChan [ch],[value]
Place the code in the Event Code of the Main Interface. To access, place your mouse over the background of the interface and hit F3 (CTRL-V to paste). When the Interface Editor opens, ensure it says main Interface in the top box. You must do this for each Interface you test. Be sure to save your Interface if you want to keep it.

That’s it! You’re ready to plot, meter and log data from the device!
While it output a voltage for plotting, you may scale the Data.
– Right-Click the plot for the pop-up menu
– Open the Settings
– Go to the Channels Tab.
– Under Pre-Plot, enter a formula to apply to the incoming data.
For example, for channel 1 with a sensor that measures 0 – 3V for a temperature sensor of 0 to 300 degrees, use the following formula:
[ain1] * 300 / 3
[ain1] will access the data of channel 1.
